# See a list of installed default packages
allpack <- installed.packages()
rownames(allpack)1.1: Introduction to Statistics
Click ![]() to open an interactive version of the full text section.
to open an interactive version of the full text section.
Statistics is the study of collection, organization, analysis, interpretation, and presentation of data. Statistical methods are essential in exploring questions that can be analyzed using data. Sometimes insights from data arise from a nice visualization or plot. Many times, a nice visualization leads to more advanced questions that require further statistical theory, models, and analysis. We will explore both modern and classical statistical methods, and in order to do so, we need data!
What is R?
R is a programming language used largely for statistical computing, data wrangling and visualization. We will be using R as a tool for exploring statistical theory. The first stable version of R was released in 2000, and after all of this time, there is a large community of R users that have already created tons of useful packages and shared interesting data sets that are frequently updated.
Note
No prior programming experience is required to begin working in R in these materials.
What Are Packages in R?
R packages are a collection functions, sample data, and/or other code scripts. R installs a set of default packages during installation.
- The files, code, and data associated to installed packages are saved in the cloud and not locally on your computer.
- Many R packages have already been installed in Google Colaboratory.
Run the code cell below to get a list of all default R packages available in Google Colaboratory.
What Data is Available in R?
R has many available data sets that we can easily import, investigate, and apply statistical methods and analysis that we will discover this semester.
- Run the code cell below to get a list of all available data sets in all available packages in R.
- A tab should open on the right displaying a long list of data sets.
- We can close the tab in order to keep a larger working window.
data(package = .packages(all.available = TRUE))Loading Packages with the library() Command
Each time we start or restart a new R session and want to access the library of functions and data in the package, we need to load the library of files in the package with the library() command.
- The
dplyrpackage is already installed in Google Colaboratory - We still need to use a
library()command to load the package if we want to access data and functions in the package. - If we do not run the code cell below, we will not be able to run the rest of the code cells in this document without receiving error messages.
- Run the code cell below to load the
dplyrpackage.
library(dplyr)
Caution
If we take a break in our work, it is possible our R session will time out and close. Each time we restart an R session, we will need to rerun library() commands in order reload any packages we plan to use.
The same caution applies to any objects, vectors, or data frames we create or edit in an R session. If a session times out, and we want to use an object x that we previously created, we will need to run the code cell(s) where object x is created again before we can refer back to x in the current session.
Finding Help Documentation
As with learning any new skill, it is always useful to know where to find help. R has been in use since 2000, and there is a large, active community of users that share lots of helpful advice online. Certainly Google or other search engines are a useful way to search and find help with R. Below are two additional websites useful for searching for help with R.
- The developers of R have useful page where to find help.
- Rseek is provided by Sasha Goodman at Stanford university. This engine lets you search several R related sites.
We can also find help without opening a separate browser window or tab. The ? help operator and help() function provide access to the help manuals for R functions, data sets, and other objects. Running a ? or help() command in a code cell opens a side bar with a tab displaying the help documentation.
- For example, the package
dplyrcontains a data set calledstorms. - Where is the data from, and what variables are in the data set?
- Run the code cell below to access the help documentation for the
stormsdata set.- Resizing the tab in the side bar may help the documentation be more readable.
- We can close the tab if we want to increase the size of our working window.
?stormsQuestion 1
After reading the storms help documentation, answer the following questions:
What is the source of the data?
What variables are include in the data?
Over what period of time and how frequently are observations recorded?
Solutions to Question 1
Question 2
Insert a code cell and run the command ?hist to see the help documentation for the histogram function.
What option can we use to add a main title to the histogram?
What option can we use to set the fill color for the bars of a histogram?
Solution to Question 2
Statistical Inference
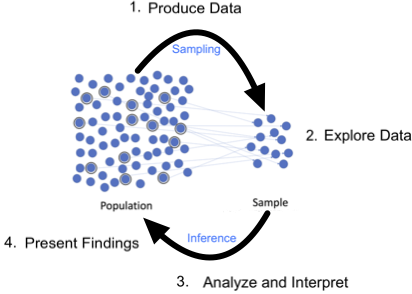
A fundamental application of statistics is to use data from a subset of a population to draw conclusions about the population.
- A population includes all individuals or objects of interest.
- A sample is a subset of the population.
- Statistical inference is the process of drawing conclusions about the entire population based on information in a sample.
- This process can be thought of as a cycle that is pictured below.
This semester we will mainly focus on steps 3 and 4; however, the methods we learn are not as powerful without carefully considering steps 1 and 2!
Produce Data
We need data to do statistics! How we design the collection of data is a crucial first step. If we collect the wrong data or biased data, we cannot gain reasonable insights to achieve our goal even if we do proper analysis. In the end, the conclusions we infer are only as strong as the data we collect.
- Experimental design is an entire field in itself and requires many considerations and techniques to ensure we can reach our ultimate goal.
- Collecting or finding the right data is a critical step that should be carefully planned.
- We do not spend too much time on this aspect of the process this semester, but we should be very aware of how important and delicate this step can be.
- There are many interesting data sets others have already collected that we can easily import into R for further analysis.
- This semester we will mostly be working with data sets that others have already carefully collected rather than produce the data ourselves.
Explore Data
Exploratory data analysis, or EDA for short, can be thought of as a cycle:
- Generate questions about our data.
- Search for answers by visualizing, transforming, and modeling our data.
- Use what we learn to refine your questions and/or generate new questions.
The main goal of EDA is to develop an understanding of your data. When we ask a question, the question focuses our attention on a specific part of the data set and helps us decide which graphs, models, or transformations to make.
- EDA can be an intricate process that requires developing some keen investigation skills.
- Exploratory Data Analysis with R by Roger Peng is a free textbook to help you dig deeper into EDA if interested!
- Our focus this semester will not be on EDA, but at times we will be exploring data in order to uncover our own statistical questions.
Analyze and Interpret
After we explore data and generate statistical questions to investigate, we apply statistical methods to analyze the data and hopefully gain insight to draw conclusions. Sometimes, even though we carefully perform our analysis correctly, we are unable to reach a decisive conclusion. Sometimes instead of reaching an answer, the insight we gain informs us to refine our question. Other times, it simply leads to more questions! Probability is required to do statistical analysis, and we will explore some key results from probability that we will need to apply in this step.
Present Findings
Finally, after we have interpreted our results, we present our findings to others. Sometimes our colleagues specialize in fields outside of mathematics, statistics, or data science. They rely on us to breakdown our findings in more practical terms accessible to a more general audience.
Professional Ethics
As we learn and refine our statistical tools, it is our duty to be mindful of the moral and ethical considerations at play in deciding what statistical questions we want to explore, how we produce data, what is the source of our data, what is the benefit to society of our work, and who is impacted by our analysis.
Below is a excerpt from An Introduction to the Science of Statistics: From Theory to Implementation by Joseph Watkins that we should always be very mindful of whether we are doing statistical analysis or other endeavors:
“Those with particular training have a special obligation to bring to the public their special knowledge. Such public statements can take several forms. We can speak out as a member of society with no particular basis in our area of expertise. We can speak out based on the wisdom that comes with this specialized knowledge. Finally, we can speak out based on a formal procedure of gathering information and reporting carefully the results of our analysis. In each case, it is our obligation to be clear about the nature of that communication and that the our statements follow the highest ethical standards. In the same vein, as consumers of information, we should have a clear understanding of the perspective in any document that presents statistical information.”
Below are two sources with ethical guidance to help steer our practice of statistics.
- Ethical Guidelines for Statistical Practice by the American Statistical Association (ASA).
- Declaration on Professional Ethics by the International Statistical Institute.
Question 3
In the storms data set, is the data from a sample or a population? What information in the help documentation supports your answer? Recall you can run the command ?storms to open the help documentation.
Solution to Question 3
Question 4
What statistical questions might be worth investigating among the variables in the storms data set? What data visualizations could be useful to uncover interesting questions?
Run the summary(storms) command in the code cell below to view a numerical summary for each variable in the data set to help formulate your question.
summary(storms)Solution to Question 4
Sampling Methods
Since drawing a sample that resembles the population in every way (except smaller in number) is critical for drawing valid conclusions, how we pick samples is crucial. Sometimes we are limited by considerations such as how expensive or timely it is to collect data from a population. We always have an obligation to be ethical in how we collect data.
Sampling bias occurs when the method of selecting a sample causes the sample to differ from the population in some relevant way. The best way to avoid bias is to take the human element out of the process.
Random Sampling Methods
When possible, collecting samples randomly without human interference is the best and therefore preferred method. Randomly selecting samples is the best way to avoid bias. Below are some common methods for selecting random samples and avoiding bias.
Simple Random Sample
When selecting a simple random sample, all individuals are equally likely to be selected.
- Assign 12 participants in an experiment a number 1 to 12. Randomly select 4 numbers and assign those individuals to treatment group A.

Stratified Sample
When selecting a stratified sample, the population is subdivided into groups based on some meaningful characteristic.
- Divide all voters into categories based on political party. Then randomly sample individuals from each political party so the overall sample has the same percentage of voters in each party as the population of all voters.

Systematic Sample
When selecting a systematic sample, the first individual is chosen at random. Then a rule is used so that every \(\mbox{n}^{\mbox{th}}\) individual is selected after that.
- Randomly select a house on a street to survey. Then pick every third house after that to include in the survey.

Cluster Sample
When selecting a cluster sample groups rather than individual units of the target population are selected at random for the test.
- Divide all voters into 10 groups based on the last digit of their social security number. Randomly pick two numbers between 0 and 9. Select all voters whose social security number ends with one of those two numbers.

Biased Sampling Methods
A convenience sample is when people or elements in a sample are selected on the basis of their accessibility and availability. For example, email a survey to your friends to gauge public support for a newly proposed law.
Voluntary sampling is a type of a convenience sample. For example, robocall all registered voters and gather responses from those that answer the phone and are willing to participate.
Designing Studies
Often in statistics we would like to investigate whether one variable is associated to another. Researchers carry out studies to understand the conditions and causes of certain outcomes.
- Does daily exercise reduce the risk of early onset dementia?
- Is rewarding people or punishing people a more effective incentive to help them quit smoking?
- Is a new vaccine effective at preventing disease?
If we are using one variable to help us understand or predict the values (or category) of another variable:
- We call the first variable the explanatory, independent, or predictor variable.
- The second the response or dependent variable.
- Different categories of a predictor variable are called treatments or levels.
Question 5
For each question below, which variable is the predictor variable and which is the response variable? How would your organize the data you collect in each case?
Does daily exercise reduce the risk of early onset dementia?
Is rewarding people or punishing people a more effective incentive to help them quit smoking?
Is a new vaccine effective at preventing disease?
Solution to Question 5
Question 6
Both studies below are designed to examine whether rewarding good behavior or punishing bad behavior is a more effective method to help people quit smoking. Which study do you believe is better designed? Why?
Study A
Employees at a large company voluntarily enroll in a quit smoking study. When they join, they are provided two options to select from:
Option 1 (Reward-based group): If after six months the participant has quit smoking, they get an $800 reward.
Option 2: (Deposit-based group): Pay an initial $150 refundable deposit. If after six months the participant:
- Has quit smoking, they receive their $150 deposit back plus an additional $800 reward.
- Has not quit smoking, then they do not receive their $150 deposit back.
After six months, we compare the success rate between the two groups to determine which method is more effective.
Study B
Employees at a large company voluntarily enroll in a quit smoking study.
- When they join, they are randomly assigned to either be in the Reward-based group or Deposit-based group with the same exact reward and penalty system for each option as in Study A.
After six months, we compare the success rate between the two groups to determine which method is more effective.
Solution to Question 6
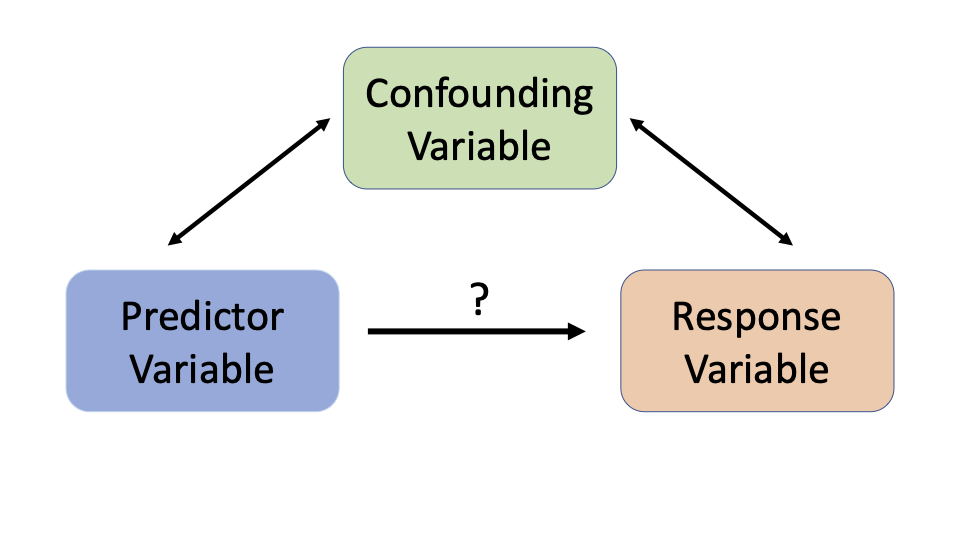
Confounding Variables
A variable that is associated with both the predictor variable and the response variable is called a confounding or lurking variable.
Question 7
In Question 6, identify a possible confounding variable in Study A or explain why there are no confounding variables. Identify a possible confounding variable in Study B or explain why there are no confounding variables.
Solution to Question 7
Experiments and Observational Studies
- An observational study is a study in which the researcher does not actively control the assignment of individuals to different treatments or levels of a predictor variable.
- If the treatment groups are chosen by the individuals in the study, the samples in each treatment group are likely to differ in some meaningful way other than just the treatment.
- An experiment is a study in which the researcher controls the assignment of individuals to different treatments or levels of a predictor variable.
- In a randomized experiment the predictor variable for each individual is determined randomly, before the response variable is measured.
- If treatment groups are randomly determined, they should be similar in every way except for the treatment itself.
- When properly designed, randomized experiments can show a predictor variable causes a change in the response variable.
There are almost always confounding variables in observational studies. Thus observational studies can almost never be used to establish causation. Sometimes it is not possible to design an experiment for ethical or practical reasons. We can still investigate whether two variables are associated with each other in observational studies.
Question 8
In Question 6, determine whether Study A is an observational study or an experiment. Determine whether Study B is an observational study or an experiment. Explain how you determined your answers.
Solution to Question 8

Statistical Methods: Exploring the Uncertain by Adam Spiegler is licensed under a Creative Commons Attribution-NonCommercial-ShareAlike 4.0 International License.