#install.packages("carData")2.1: An Overview of Probability
![]()
Statistical inference is the process of using data from a sample to describe characteristics of the population. Our conclusions are going to be based on randomness in the sampling process, and we will need to account for some uncertainty in our predictions. Statistics relies on theory and applications from probability to help quantify the uncertainty in our models and estimates.
- If we know the make up of a population, we can use probability to predict the likelihood that certain outcomes occur.
- If we know a six-sided is fair, what is the probability of rolling the die 10 times and getting exactly 4 rolls that land on 1?
- We use statistics to go in the reverse direction. Namely, how can we make predictions about a population from a random sample of data.
- We want to determine whether or not a six-sided die is fair. We roll the die 100 times and get 40 rolls that land on 1. Is the die fair?
- We will need to use probability to answer statistical questions and make inferences about a population.
Sample Space, Outcomes and Events
A statistical experiment or observation is any random activity that results in a definite outcome.
- The sample space, \(\color{dodgerblue}{\Omega}\), is the set of all possible outcomes of an experiment.
- An outcome, \(\color{dodgerblue}{\omega}\), is a result from an experiment or observation.
- An event, \(\color{dodgerblue}{A}\), is a collection of one or more outcomes from an experiment or observation.
Example: Rolling a Fair Six-Sided Die
![]()
The study of probability was initially inspired by calculating odds of outcomes from card and dice games. For example, consider a rolling a fair six-sided die.
- The sample space is \(\Omega = \left\{ 1, 2, 3, 4, 5, 6 \right\}\)
- For a fair die, each of the six possible outcomes has an equally likely chance of occurring.
- One possible outcome is rolling a 4, \(\omega = 4\)
- Let \(A\) denote the event that the roll is a multiple of 3, \(A = \left\{ 3, 6 \right\}\).
Probabilities with Equally Likely Outcomes
For finite sample spaces, we often use counting to determine probabilities. A special case which we will encounter often is when each outcome in the sample space \(\Omega\) is equally likely to occur, and therefore
\[ P(A) = \frac{\mbox{Number of outcomes in event $A$}}{\mbox{Total number of outcomes in $\Omega$}} = \frac{|A|}{|\Omega|}.\]
We use the notation \(P(A)\) to denote the probability that event \(A\) occurs.
- Probabilities are proportions between \(0\) (impossible to occur) and \(1\) (certain to occur) that we typically represent as decimals or fractions.
- The probability \(P: \Omega \rightarrow \mathbb{R}\) is a function that maps each event in \(\Omega\) to a number in the interval \(0 \leq P(A) \leq 1\).
- Sometimes we convert the proportion to a percentage when giving a probability.
Question 1
If a person rolls a fair, six-sided die, what is the probability the result of the roll is a number that is divisible by 3?
Solution to Question 1
Installing and Loading carData Package
The data set Arrests is in the carData package in R which is not installed in Google Colaboratory.
- First run the code cell below to to install the
carDatapackage.
- Next load the package with the library command so we can access the
Arrestsdata set.
library(carData)- We can now access and explore the data set
ArrestsincarData.
Question 2
Use R functions such as summary(), str(), and/or ?Arrests to answer some questions about the data:
- What data is included in the
Arrestsdata set? - How many observations are in the data?
- What is the population of interest?
- What is the source of the data?
- What are the categorical variables in the data set?
- What are the quantitative variables in the data set?
- Are the variable data types accurate, or do some variables need to be converted to other data types?
Solution to Question 2
# Use code cell to summarize and/or get help with Arrests data
Question 3
Suppose you would like to analyze whether Black arrestees are more or less likely to be not released with a summons (and therefore detained in jail) compared to White arrestees. The two variables of interest are therefore colour and released.
Question 3a
Use the table() function, create a two-way table to summarize the relation between colour and released.
Solution to Question 3a
table(??)Question 3b
You should see from your output in Question 3a that more White arrestees were released (559) compared the Black arrestees that were released (333). Why is it problematic to compare counts of White and Black arrestees and conclude White arrestees are more likely to be detained (not be released)?
Solution to Question 3b
Question 3c
What is the probability that a randomly selected arrestee in the study:
- Was not released?
- Was Black?
- Was not released and was Black?
- Was not released or was Black?
- Given that a person was Black, what is the probability they were not released?
Solution to Question 3c
Use the code cell below to compute each of the probabilities (i)-(v).
# Enter code to compute each of the following
# Be sure to print results to screen!
# Find the probability that a randomly selected person in the study:

# (i) was not released


# (ii) was Black


# (iii) was not released and was Black


# (iv) was not released or was Black?


# (v) was not released given they were Black
Summarize results below
The probability that a randomly selected person in the study was not released is \({\color{dodgerblue}{P(N)=??}}\).
The probability that a randomly selected person in the study was Black is \({\color{dodgerblue}{P(B)=??}}.\)
The probability that a randomly selected person in the study was not released and was Black is \({\color{dodgerblue}{P(N \cap B)=??}}\).
The probability that a randomly selected person in the study was not released or was Black is \({\color{dodgerblue}{P(N \cup B)=??}}\).
Given that a person was Black, what is the probability they were not released?
\[{\color{dodgerblue}{P(N \ | \ B)=??}}\]
Question 3d
Based on the data from this study, do you believe Black arrestees are more, less, or equally likely to be detained (not be released) than White arrestees? Support your answer using probabilities. You may want to compute additional probabilities that were not asked in Question 3c before reaching your conclusion.
Solution to Question 3d
Simple and Compound Probabilities
Let \(A\) and \(B\) denote two events in sample space \(\Omega\), then
- \(\color{dodgerblue}{P(A)}\) is the probability that event \(A\) occurs.
- \(\color{dodgerblue}{P(A^C) = P(\bar{A}) = P(A')}\) is the probability that event \(A\) does NOT occur.
- The notation \(\color{dodgerblue}{A^C}\), \(\color{dodgerblue}{\bar{A}}\), or \(\color{dodgerblue}{A'}\) are used to denote the complement of \(A\).
- \(\color{dodgerblue}{P(A \cap B)}\) is the probability that events \(A\) and \(B\) both occur.
- \(\color{dodgerblue}{P(A \cup B)}\) is the probability that either event \(A\) or event \(B\) occurs (or both \(A\) and \(B\) occur).
- \(\color{dodgerblue}{P(B \ | \ A )}\) is the conditional probability that event \(B\) occurs given that event \(A\) occurs.
- \(\color{dodgerblue}{P(A - B)}\) is the probability that event A occurs and event B does not occur.
Properties of Probability
We can generalize the calculations from the previous study on people arrested for small quantities of marijuana to obtain the following results:
Let \(A\) and \(B\) denote two events in sample space \(\Omega\), then
- Additive property: \(P(A \cup B) = P(A) + P(B) - P(A \cap B)\).
- Bayes’ Theorem: \(\displaystyle P(B | A) = \frac{P(A \cap B)}{P(A)}\)
- Multiplicative property: \(P(A \cap B) = P(A) \cdot P(B | A)\)
- Complement property: \(P(A^C) = 1 - P(A)\)
Question 4
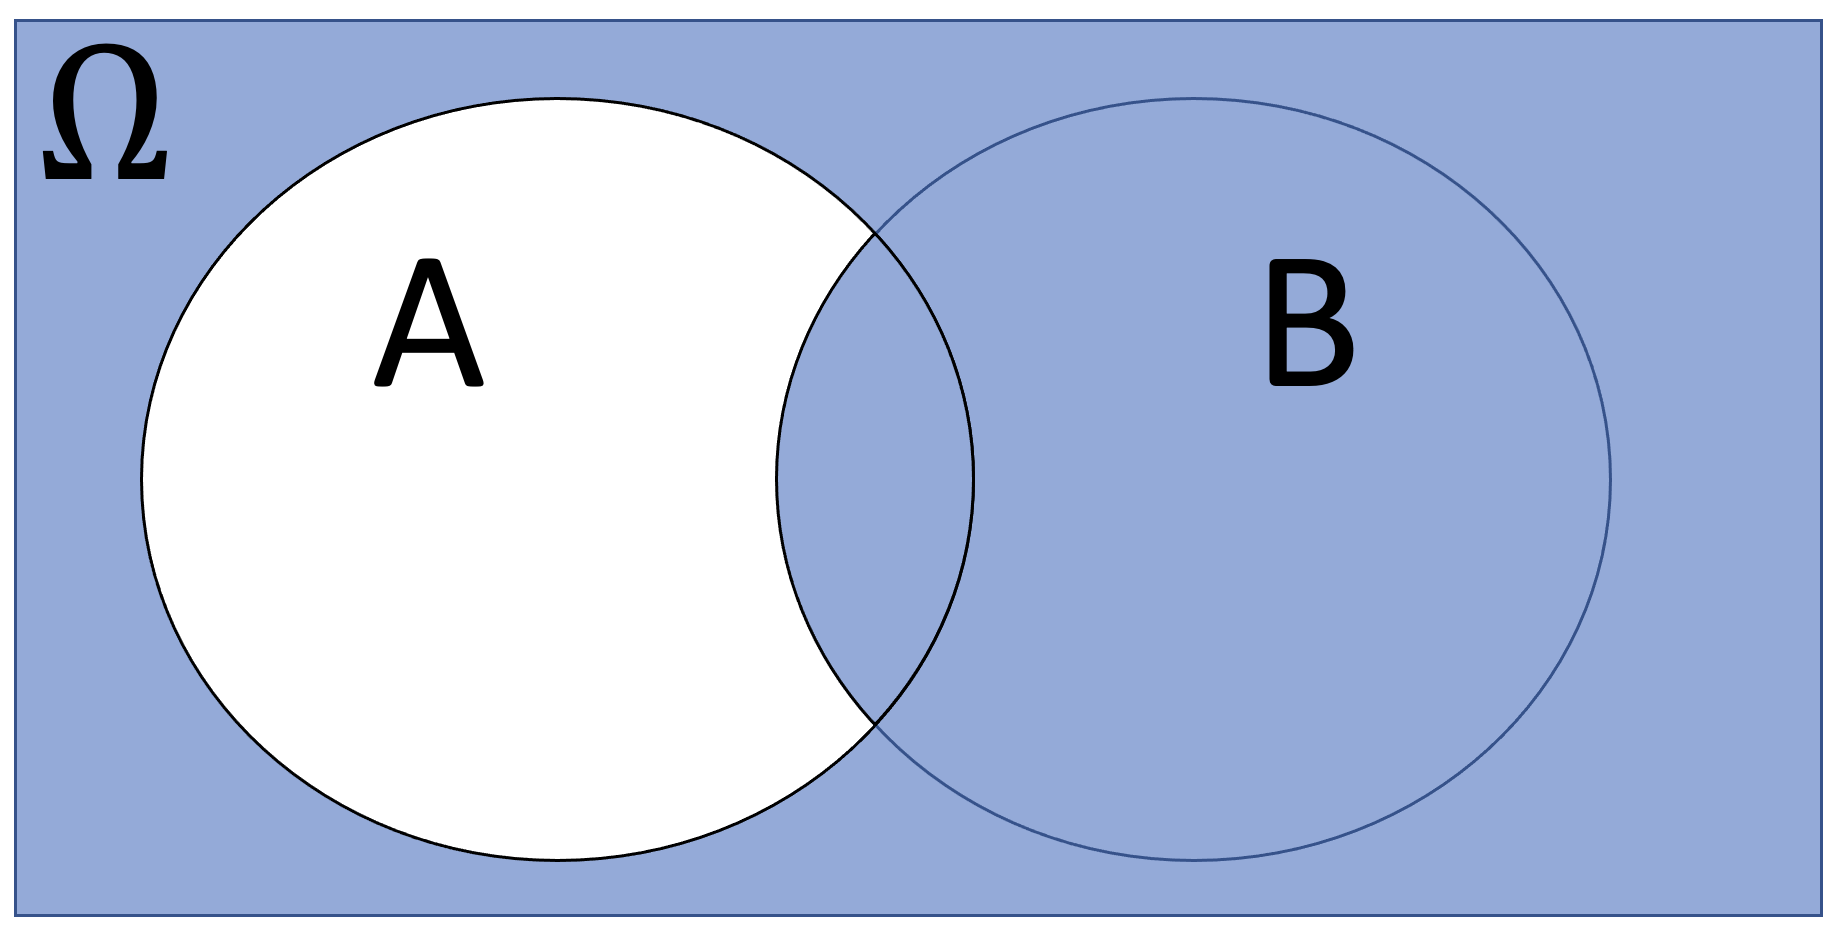
Match one of the Venn diagrams labelled (i)-(vi) in the table below to one of the set operations below. Note that two of the Venn Diagrams do not match any of the set operations.
Match one of the Venn diagrams labelled (i)-(vi) in the table below to one of the set operations below. Note that two of the Venn Diagrams do not match any of the set operations.
| diagram (i) | diagram (ii) | diagram (iii) |
|---|---|---|
 |
 |
 |
| diagram (iv) | diagram (v) | diagram (vi) |
|---|---|---|
 |
 |
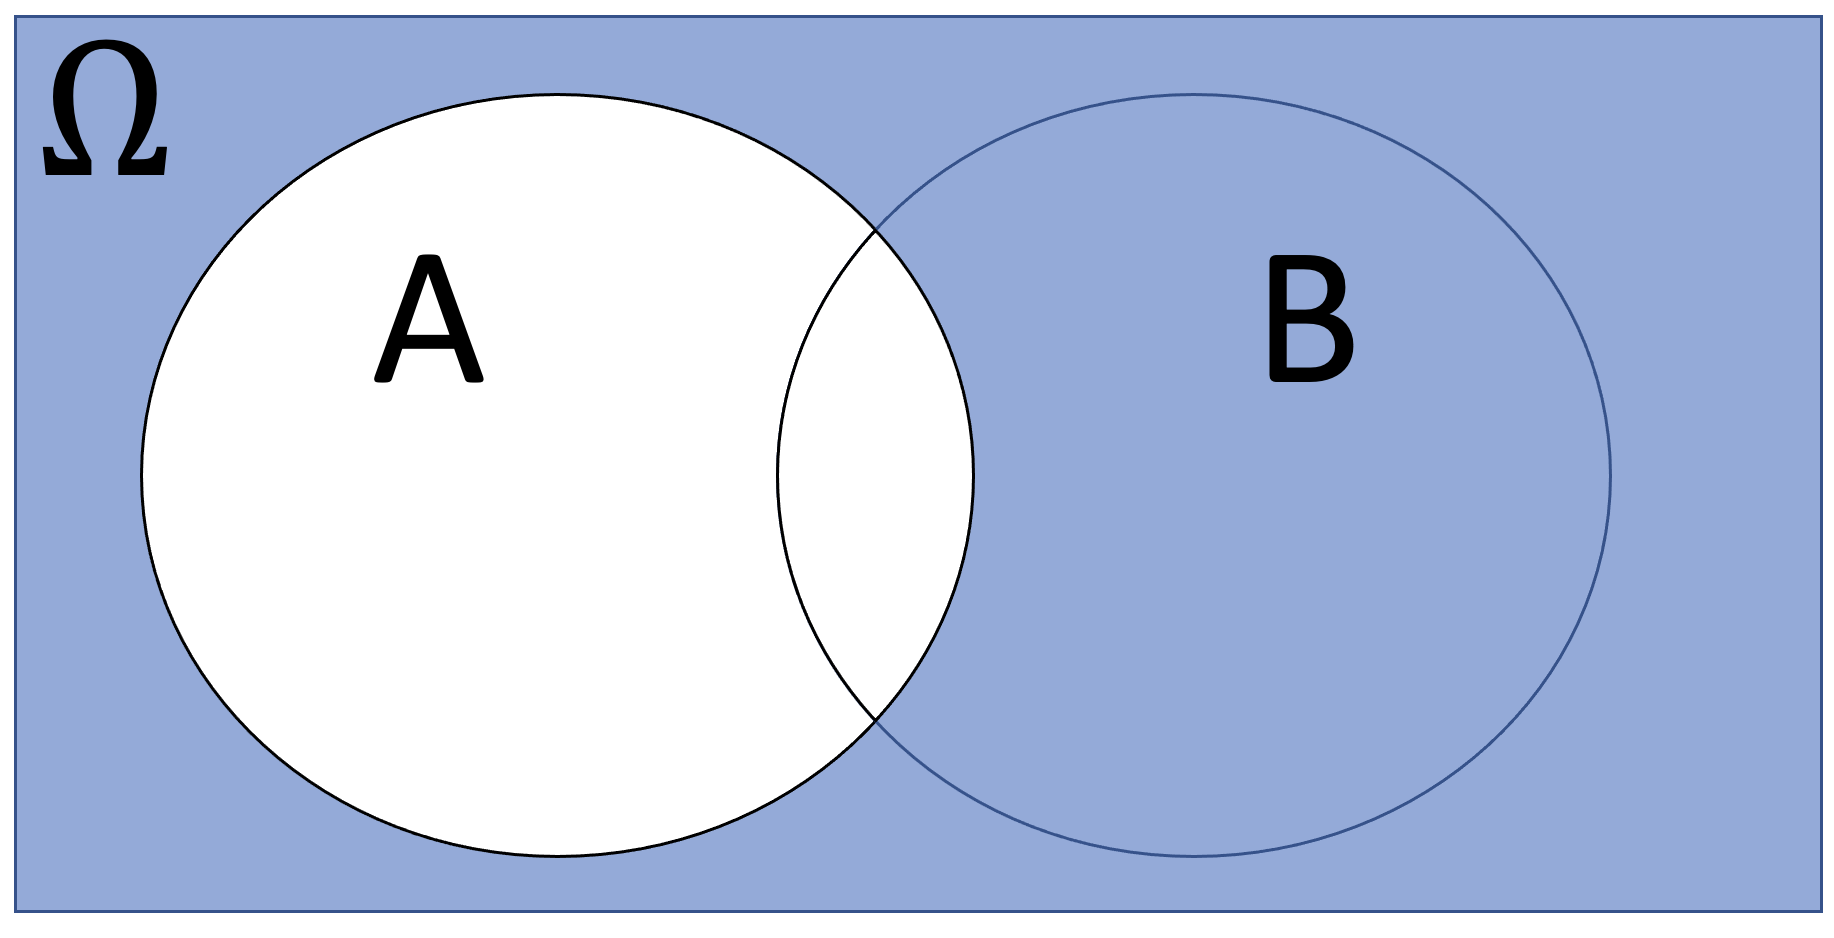 |
Image credit: Adam Spiegler, CC BY-SA 4.0, via Wikimedia Commons
Solution to Question 4
| \(A^C\) | \(A \cup B\) | \(A \cap B\) | \(A-B\) |
|---|---|---|---|
| Diagram ?? | Diagram ?? | Diagram ?? | Diagram ?? |
Question 5
When a customer purchases a new car, they are presented with a menu of options such as heated steering wheel, parking assistant, satellite radio, etc. The two most popular options on a certain type of new car are a sunroof (denoted \(S\)) and heated seats (denoted by \(H\)). Answer the following questions if we know that
\[ P(S) = 0.6, \quad P(H) = 0.45,\mbox{ and } P(H | S ) = 0.65. \]
Question 5a
Interpret the practical meaning of \(P(H | S ) = 0.65\).
Solution to Question 5a
Question 5b
Compute \(P(H^C)\) and interpret the meaning.
Solution to Question 5b
Question 5c
Compute \(P(S \cap H)\) and interpret the meaning.
Solution to Question 5c
Question 5d
Compute \(P(S | H)\) and interpret the meaning.
Solution to Question 5d
Question 5e
Given a customer has purchased the sunroof option, are they more, less, or equally likely to get the heated seats option? Which probabilities did you use to determine your answer? Does this make practical sense in this context?
Solution to Question 5e
Independent Events
Often in statistics we want to investigate questions such as:
- Is a newly developed vaccine effective?
- Do certain sentencing laws have an effect on crime rates?
- Did increasing the minimum wage for fast food workers effect fast food prices?
- Does the occurrence of one event \(H\) (heated seats) effect the likelihood that another event \(S\) (sunroof) occurs?
Definition of Independent Events
Two events \(A\) and \(B\) are independent if the occurrence of one has no effect on the occurrence of the other:
\[ P(B) = P(B \ | \ A) \quad \mbox{or} \quad P(A) = P(A \ | \ B).\]
Special case: If events \(A\) and \(B\) are independent events then we have \(P(A \cap B) = P(A)P(B)\).
Question 6
Consider the board game picture below. You begin at the start position and flip a fair coin. If the result of the flip is tails, you move forward one space on the board. If the result is heads, you move forward two spaces on the board. Keep flipping a fair coin (with tails moving one space and heads two spaces) until you reach the winner position.

- What is the probability that you win in exactly two flips?
- What is the probability that you win in exactly three flips?
- What is the probability that you win in exactly four flips?
Solution to Question 6
Question 7
Does having health insurance help avoid bankruptcies? Let \(B\) denote the event a person goes bankrupt. Let \(H\) denote the event a person has health insurance.
Question 7a
What is the difference in the practical meaning \(P(H \ | \ B)\) and \(P(B \ | \ H )\)? Explain in practical terms that a non-statistician could understand, and avoiding technical language.
Solution to Question 7a
Question 7b
Can you determine whether having health insurance has any affect on the likelihood that a person goes bankrupt by comparing \(P(H \ | \ B)\) and \(P(B \ | \ H )\)?
- If so, explain how you would compare those to probabilities to help answer the question.
- If not, what additional probability (or probabilities) would be useful to know in order to answer this question.
Solution to Question 7b
Mutually Exclusive Events
Two events \(A\) and \(B\) are mutually exclusive (or disjoint) if they cannot occur at the same time, and therefore \(P(A \cap B) = 0\).
Special case: If events \(A\) and \(B\) are disjoint then we have \(P(A \cup B) = P(A)+P(B)\).
Question 8
Give an example of two events that are mutually exclusive, and give an example of two events that are not mutually exclusive.
Solution to Question 8
Probability Distributions
A function \(P\) that assigns a real number \(P(A)\) to each event \(A\) is a probability distribution or a probability measure if it satisfies the following three axioms:
- \(P(A) \geq 0\) for all \(A\).
- \(P(\mbox{full sample space})=P(\Omega) = 1\).
- If \(A\) and \(B\) are disjoint, then
\[P \left( A \cup B \right) = P(A) + P(B).\]
Appendix: Bayes’ Theorem
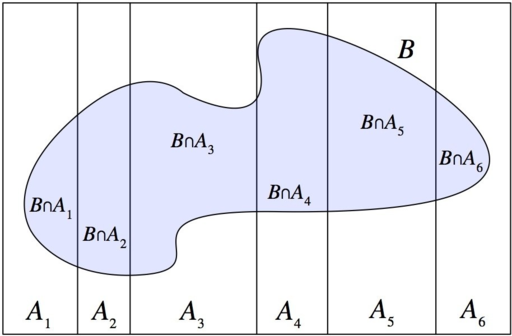
Partitions of Sample Spaces
A partition of a space \(\Omega\) is a collection of disjoint sets such that \(\displaystyle \bigcup_{i=1}^{\infty} A_i = \Omega\).
Question 9
Fill in the blank to complete theorem below and explain (in words, pictures, or equations) how you determined your answer.
Let \(A_1\), \(A_2\), \(\ldots , A_k\) be a partition of \(\Omega\). Then for any event \(B\),
\[P(B) = \sum_{i=1}^k \_\_\_\_ .\]
Solution to Question 9
Statement of Bayes’ Theorem
Let \(A_1\), \(A_2\), \(\ldots , A_k\) be a partition of \(\Omega\) such that \(P(A_i)>0\) for each \(i\). If \(B\) is any event with \(P(B)>0\), then for each \(i=1, \ldots k\), we have
\[P(A_i \mid B) = \frac{P(A_i \cap B) }{P(B)} = \frac{P(B \mid A_i) P(A_i)}{\sum_{j=1}^k P(B \mid A_j)P(A_j)}.\]
Question 10
Suppose that 30% of computers run Mac, 50% use PC, and 20% use Linux. A computer virus is created by hackers, and suppose that 65% of Mac, 82% of PC, and 50% of Linux computers get the virus.
Question 10a
What is the probability that a randomly selected computer has the virus?
Solution to Question 10a
Question 10b
What is the probability that a randomly selected computer is PC given that the computer is infected by the virus?
Solution to Question 10b

Statistical Methods: Exploring the Uncertain by Adam Spiegler is licensed under a Creative Commons Attribution-NonCommercial-ShareAlike 4.0 International License.