# enter each sample as a vector below
even <- c(15, 8, 8.75, 13.17)   # even-split data
control <- c(??)  # control data

# calculate an appropriate test statistic6.1: Introduction to Hypothesis Tests
![]()

In a statistical hypothesis test:
- A researcher wants to determine which of two competing claims is more likely true.
- Researchers collect data and compare statistics.
- Based on data collected, researchers assess which of the two claims seems more likely.
Some examples of questions that could be answered using a hypothesis test are:
- What is a better method to help smokers quit: give them money for successfully quitting, or penalize them if they don’t stop?
- What is the better mailer to send in order to nudge voters into actually voting?
- What is a more effective government assistance program, giving people food stamps or cash?
Note the difference in the how the statistical question is framed compared to our prior work with estimators and confidence intervals.
- Confidence intervals are used to estimate the value of an unknown population parameter.
- Estimate the difference in two means between two independent treatment groups.
- Hypothesis tests are used to gauge competing claims related to an unknown population parameter.
- Is Treatment A better than Treatment B?
Hypothesis testing provides a statistical framework for analyzing data, determining significance, and ultimately making a decision about the claims.
An Experiment with Telepathy
We refer to the two competing hypotheses as the null hypothesis, denoted by \(\color{dodgerblue}{H_0}\), and the alternative hypothesis, denoted by \(\color{tomato}{H_a}\).
- \(\color{dodgerblue}{H_0}\): The boring claim that nothing interesting is happening.
- \(\color{tomato}{H_a}\): The new or different result a researcher is trying to establish or find evidence to support.
Question 1
Telepathy is the ability of an individual to communicate thoughts and ideas by means other than the known senses. I claim that I do have telepathy. There are two possibilities: either I do or I do not. Which claim is the null hypothesis and which is the alternative?
Solution to Question 1
Question 2
There are many different studies we could design to test these competing claims. I will collect data as as follows:
- I will think of a letter A, B, C, or D.
- I will telepathically communicate this letter to everyone.
- Each person will tell me what letter they believed I was thinking of.
If I could collect responses from everyone in the population, I could calculate the parameter \(p\), the proportion of all responses from everyone in the world that are the correct letter.
- If \(H_0\) is true, what would you expect the value of \(p\) to be?
- If \(H_a\) is true, what would you expect the value of \(p\) to be?
Solution to Question 2
Question 3
I cannot conduct my study on everyone in the world. Instead, I pick a sample of people from which to collect data. Suppose I am in a room with 15 other people who will participate in the study as designed in Question 2. Let \(\hat{p}\) denote the proportion of the people in the room that correctly say the letter I was thinking of.
What would be enough evidence to convince you that I do have telepathy?
State your answer in terms of the value of the sample proportion \(\hat{p}\).
Solution to Question 3
Performing a Hypothesis Test
The general process for performing a hypothesis test is informally:
- State the null and alternative hypotheses in terms of population parameter(s).
- Collect data from a sample and calculate test statistic(s).
- Assess which claim is more likely to be true.
- What conclusions (if any) can we make about the two competing claims?
We will dive deeper into each step, but for now we take a tour through the process in the context of two different studies. Before considering our first example, we focus on setting up the hypotheses in Step 1.
Stating the Hypotheses
Deciding on a clear and pertinent set of hypotheses is perhaps the most important step in hypothesis testing. Carefully setting up hypotheses helps keep our analysis on track so we achieve our goal.
The Null and Alternative Hypotheses
- The null hypothesis is a “boring” claim. If the null hypothesis is true, this would not really affect or change what is currently believed.
- The alternative hypothesis is the new or exciting claim a researcher is hoping to establish that is in direct competition with the boring claim in the null hypothesis.
For example, we generally believe coins are “fair” in the sense that when you flip a coin it has a 50% chance of landing on heads and a 50% chance of landing on tails. It would be more interesting if somebody claimed that a coin was not fair.
Two-Tailed Tests
Let \(p\) denote the proportion of all flips of a coin that land on heads. If our goal is to show a coin is not fair, without indicating a direction of the bias, we could set up hypotheses
- \(H_0\): \(p=0.5\). The coin is fair (boring).
- \(H_a\): \({\color{tomato}{p \ne 0.5}}\). The coin is not fair (what we want to prove).
If we claim a coin is not fair without specifying a direction of the bias, we use a \({\color{tomato}{\ne}}\) sign in \(H_a\), and we say the test is a two-tailed test. There are other ways we could claim a coin is biased.
One-Tailed Tests
A coin might be more biased to land on heads (\(p > 0.5\)). A coin might be more biased to land on tails (\(p < 0.5\)).
- If we want to test the claim that a coin is biased to land on heads:
- \(H_0\): \(p=0.5\). The coin is fair (boring).
- \(H_a\): \({\color{tomato}{p > 0.5}}\). The coin is biased to heads (what we want to prove).
- If we want to test the claim that a coin is biased to land on tails:
- \(H_0\): \(p=0.5\). The coin is fair (boring).
- \(H_a\): \({\color{tomato}{p < 0.5}}\). The coin is biased to tails (what we want to prove).
When we specify a direction of the inequality we use either \(>\) or \(<\) in \(H_a\), and we say the test is a one-tailed test.
Guidelines for Stating Hypotheses
From the examples above, we note some helpful guidelines for setting up hypotheses:
- We state hypotheses both in words and using mathematical notation.
- Clearly stating the hypothesis in words will help us interpret results.
- Using appropriate mathematical notation will help guide our statistical analysis.
- The hypotheses must be competing claims.
- Be sure to clearly indicate the population of interest.
- When using notation to state the hypotheses:
- Use population parameters such as \(\mu\) and \(p\).
- Do not state hypotheses using statistics such as \(\bar{x}\) or \(\hat{p}\).
- We always use an equality sign, \(=\), in \(H_0\).
- We always use an inequality sign (\(\ne\), \(>\), or \(<\)) in \(H_a\).
Computing a Test Statistic
Stating our hypotheses in mathematical notation is extremely helpful in helping us decide which sample statistics will be most helpful in assessing our hypotheses. Essentially, based on the population parameters we use in \(H_0\) and \(H_a\), we use the corresponding statistic(s) from the sample(s). For example:
- If we want to test claims about \(p\), calculating \(\hat{p}\) will be useful.
- If we want to test claims about \(\mu_1 - \mu_2\), calculating \(\bar{x}_1-\bar{x}_2\) will be useful.
Often we standardize statistics, for example using \(z\)-scores. We will explore this idea more deeply later.
Assess Which Claim is More Likely
When we set up hypotheses, we use a boring claim for the null hypothesis the that is generally assumed to be true. The alternative hypothesis is a new claim, if true, would cause us to doubt and possibly reject the null claim.
- Our goal is not to prove anything about the null claim \(H_0\).
- Our goal is to show \(H_a\) is very likely true by showing \(H_0\) is very unlikely to be true.
The logic in hypothesis testing is similar to a proof technique called proof by contradiction.
- We assume the boring claim \(H_0\) is true.
- We hope to prove our assumption is unlikely, and thus the opposite (\(H_a)\) is true.
Based on our test statistic(s) and whether the alternative hypothesis is two-tailed or one-tailed, we assess statistical significance as follows:
- If the test statistic is likely if \(H_0\) is true, then we do not have evidence to reject \(H_0\).
- The test is not statistically significant.
- The test is inconclusive.
- We neither reject nor accept \(H_0\).
- If the test statistic is unlikely if \(H_0\) is true in the direction of the claim in \(H_a\), then we have evidence that refutes \(H_0\) and supports \(H_a\).
- The test is statistically significant.
- We reject \(H_0\) and accept \(H_a\).
What do we mean be “likely” and “unlikely”? We consider the concept informally at first, and we will explore this concept more deeply later using p-values.
Making a Conclusion
In the end, there are two possible results from a hypothesis test. Either:
- The test is statistically significant.
- We reject \(H_0\).
- We accept the competing claim, \(H_a\).
- The test is not statistically significant.
- We fail to reject \(H_0\). We do NOT accept \(H_0\).
- The test is inconclusive as far as \(H_a\) is considered,
We will more formally discuss just how unlikely or likely a sample must be in order to for the result to be statistically significant. Informally, we assume the null hypothesis is true and require evidence beyond a reasonable doubt that \(\mathbf{H_0}\) is not true in order to be convinced we should reject \(H_0\).
We do not want different researchers subjectively choosing what “beyond a reasonable doubt” means to them. We hope to control for confounding variables in our studies, and making this decision as objective as possible helps account for potential bias by the researchers. In statistical hypothesis testing, a significance level is used to make this decision.
Question 4: Unscrupulous Diner’s Dilemma

An article1 from The Economic Journal studied the so called unscrupulous diner’s dilemma.
The unscrupulous diner’s dilemma is a problem faced frequently in social settings. When a group of diners jointly enjoys a meal at a restaurant, often an unspoken agreement exists to divide the check equally. A selfish diner could thereby enjoy exceptional dinners at bargain prices. This dilemma typifies a class of serious social problems2 from environmental protection and resource conservation to eliciting charity donations and slowing arms races.
Researchers wanted to test whether people order more food and beverages when they know the bill is going to split evenly, or do they order the same amount regardless of whether they are splitting the bill or paying individually.
Question 4a
State the null and alternative hypotheses both in words and using mathematical notation.
Solution to Question 4a
Question 4b
To test the claims, participants were randomly assigned into two tables, each with four people. One table (even-split group) was randomly picked and told they were going to evenly-split the bill. The other table (control) was told each person was going to pay for what they ordered. The mean amount ordered by the control group was \(\$8.67\). Which of following samples for the even-split group is the most statistically significant? Support your answer with an explanation.
| Test Stat 1 | Test Stat 2 | Test Stat 3 | Test Stat 4 |
|---|---|---|---|
| \(\$4.67\) | \(\$8.50\) | \(\$8.80\) | \(\$11.23\) |
Solution to Question 4b
Question 4c
If the table below gives the amounts ordered by each of the four people in each group, what is the value of the test statistic? Complete the R code cell below to calculate a test statistic.
Even-Split Group
| Person 1 | Person 2 | Person 3 | Person 4 |
|---|---|---|---|
| \(\$15.00\) | \(\$8.00\) | \(\$8.75\) | \(\$13.17\) |
Control Group
| Person 1 | Person 2 | Person 3 | Person 4 |
|---|---|---|---|
| \(\$8.50\) | \(\$7.90\) | \(\$10.85\) | \(\$7.43\) |
Solution to Question 4c
Question 4d
Based on the test statistic, what do you think we can conclude about the two competing claims?
Solution to Question 4d
Question 5: Social Pressure and Voter Turnout
A 2008 experiment3 at Yale aimed to determine whether positive or negative pressure is more effective at improving voter turnout.
Voter turnout theories based on rational self-interested behavior generally fail to predict significant turnout unless they account for the utility that citizens receive from performing their civic duty. We distinguish between two aspects of this type of utility,
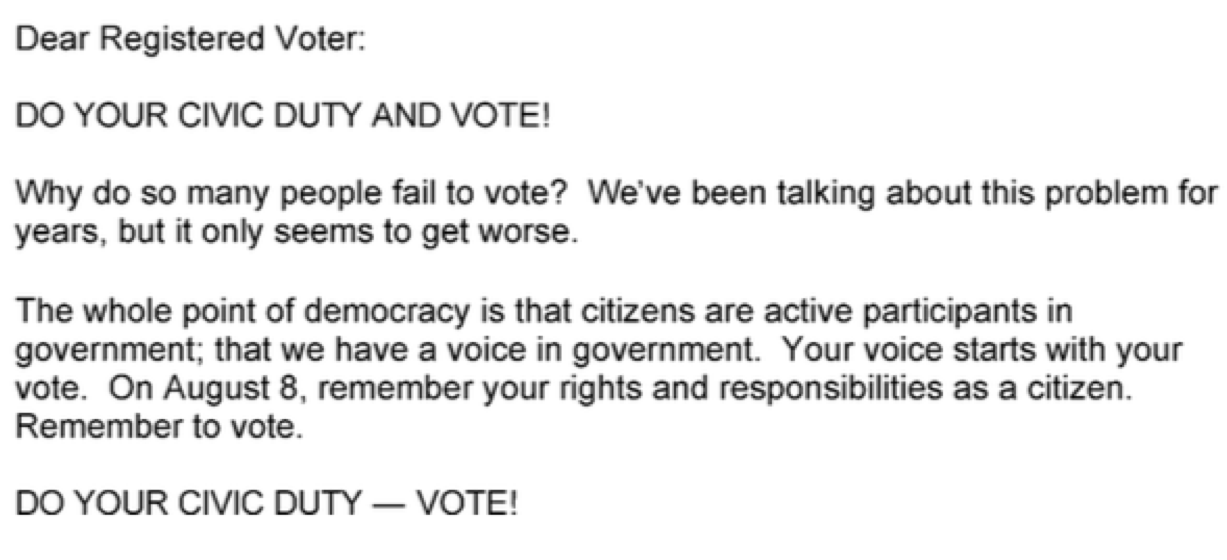
One group received a mailing emphasizing the intrinsic (internal) satisfaction for voting:
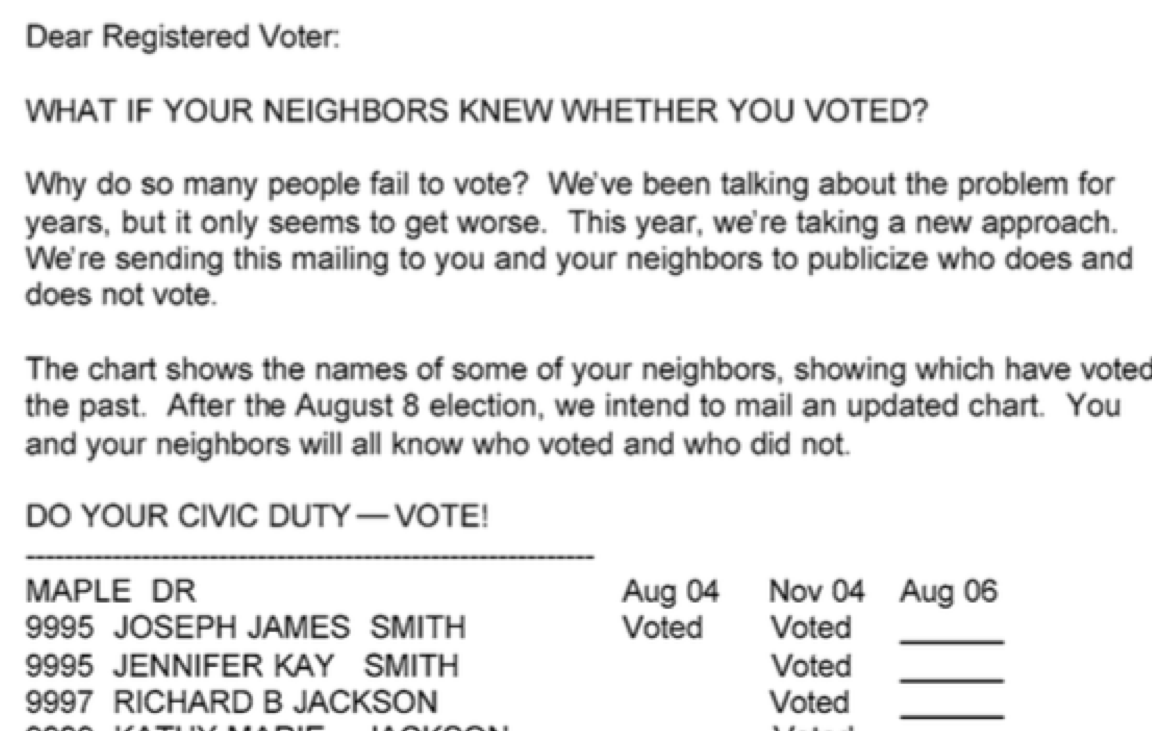
Another group received a mailing placing extrinsic (outside) pressure on people to vote:
Question 5a
State the null and alternative hypotheses the researches can use to test whether positive or negative pressure is more effective at improving voter turnout. State the hypotheses both in words and using mathematical notation.
Solution to Question 5a
Question 5b
What is a possible test statistic the researchers could use to assess the competing claims in your previous answer? There is not a specific value to give. Rather, explain how you could use sample data to compute a test statistic.
Solution to Question 5b
Measuring Significance: p-Values
Earlier we informally discussed the concept of significance. Recall the logic of hypothesis tests, we assume \(H_0\) is true and consider whether the sample data supports or refutes the null claim. \(p\)-values are more formal statistics used to measure significance in hypothesis testing.
The \(\color{dodgerblue}{\mathbf{p}}\)-value is the probability that we would get a random sample with a test statistic as or more extreme as the observed test statistic if the null hypothesis were true.
\[{\large {\color{dodgerblue}{p\mbox{-value} = P( \mbox{test statistic as or more extreme than observed} \ | \ H_0 \mbox{ is true} )}}}.\]
- The smaller the \(p\)-value, the less likely the sample is assuming \(H_0\) is true.
- There is evidence that contradicts \(H_0\) and supports \(H_a\).
- The smaller the \(p\)-value, the more statistically significant the result.
Note
A \(p\)-value is a probability, so we have \(0 < p\mbox{-value} < 1\). The closer the \(p\)-value is to \(0\), the more significant the result.
Caution
\(p\)-values measure the probability of our observed sample (assuming \(H_0\) is true). \(p\)-values do not measure the probability that either \(H_0\) or \(H_a\) is correct or not.
Question 6
Recall the telepathy example in Questions 1, 2, and 3. Let \(T\) be the number of people (out of the possible 15 people in the room) that said the correct the letter I was thinking. Suppose we observed that 12 out of 15 people correctly said the letter I was thinking.
Question 6a
Calculate the \(p\)-value of the observed test statistic. Use the R code cell below to help with the calculation.
Tip
In 15 identical and independent trials under the assumption \(H_0\) is true, what is \(P(T \geq 12)\)?
Solution to Question 6a
# p-value of the observed 12 out 15 successes
Question 6b
Based on the value of the \(p\)-value, what can we conclude about my telepathy ability?
Solution to Question 6b
The Null Distribution
The null distribution is the distribution of the test statistic if the null hypothesis is true. We use the null distribution to calculate the p-value.
Question 7
What is the null distribution for the previous telepathy example?
Solution to Question 7

Statistical Methods: Exploring the Uncertain by Adam Spiegler is licensed under a Creative Commons Attribution-NonCommercial-ShareAlike 4.0 International License.
Gneezy, U., E. Haruvy, and H. Yafe (2004), “The Inefficiency of Splitting the Bill”, The Economic Journal 114↩︎
Glance, N., and B. Huberman, “The Dynamics of Social Dilemmas”, Scientific American↩︎
Gerber, A., D. Green, and C. Larimer, “Social Pressure and Voter Turnout: Evidence from a Largescale Field Experiment”, American Political Science Review, Feb 2008↩︎