# code cell to help with calculations6.5: Error Types and Power of Tests
Potential Errors with Hypothesis Tests


The result of a hypothesis test has one of two possibilities:
- If p-value \(\leq \alpha\), we reject \(H_0\), and we have enough evidence to support the claim in \(H_a\).
- If p-value \(> \alpha\), we fail to reject \(H_0\). However, in this case we do not accept \(H_0\). The test is inconclusive.
As with confidence intervals, it is possible we do all of our analysis perfectly without any mistakes, but our conclusion is incorrect due to the randomness in sampling. Rarely, we are unlucky and dealt a biased sample, in which case we arrive at an incorrect conclusion.
In this section, we explore the following questions:
- What type of errors are possible with hypothesis testing?
- What are the practical implications of making errors?
- How can we calculate the probability of correctly rejecting \(H_0\)?
Type I and Type II Errors
There are two possible errors in a hypothesis test:
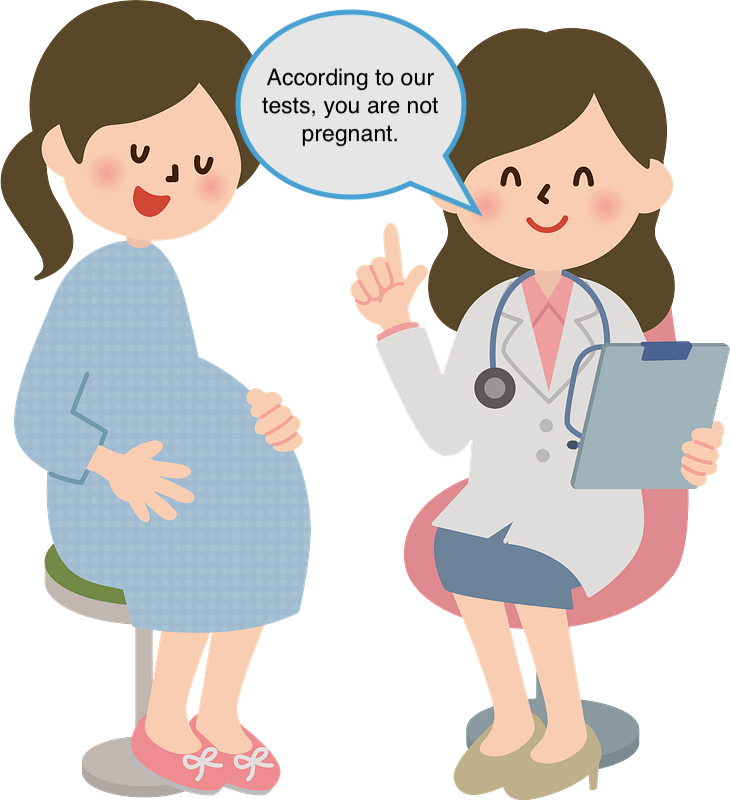
- A type I error occurs if we incorrectly reject \(H_0\) when it is true.
- This is known as a false positive.
- For example, a jury falsely convicts an innocent person.
- A type II error occurs if we incorrectly fail to reject \(H_0\) when it is false.
- This is known as a false negative.
- For example, a jury fails to convict a guilty person.
For example, when a jury is deciding a case in court, the hypotheses would be:
- \(H_0\): The accused person is innocent (we assume the person is innocent).
- \(H_a\): The accused person is guilty (requires evidence beyond a reasonable doubt).
A jury can make two possible errors:
- If they falsely convict an innocent person, they have made a type I error.
- If they do not convict a guilty person, they have made a type II error.
Question 1
A hospital is testing to see whether a donated organ is a match for a recipient in need of an organ transplant.
- \(H_0\): The organ is not a match (boring).
- \(H_a\): The organ is a match (interesting).
Describe the type I and type II errors in this context. What are the practical consequences of making these errors?
Solution to Question 1
Question 2
A lab runs viral tests to see whether a person is currently infected with COVID-19.
- \(H_0\): The person is not currently infected with COVID-19 (boring).
- \(H_a\): The person is currently infected with COVID-19 (interesting).
Describe the type I and type II errors in this context. What are the practical consequences of making these errors?
Solution to Question 2
Question 3
The cholesterol level of healthy men is normally distributed with a mean of 180 mg/dL and a standard deviation of 20 mg/dL, whereas men predisposed to heart disease have a mean cholesterol level of 300 mg/dL with a standard deviation of 30 mg/dL. The cholesterol level 225 mg/dL is used to demarcate healthy from predisposed men.
Question 3a
Given that a man is healthy, what is the probability they are diagnosed as predisposed?
Solution to Question 3a
Question 3b
Given that a man is not healthy, what is the probability they are not diagnosed as predisposed?
Solution to Question 3b
# code cell to help with calculations
Question 3c
Which of the previous answers gives the probability of a type I error and which is for a type II error? Explain.
Solution to Question 3c
Question 4
Suppose we want to test whether a ten-sided die is fair (with sides numbered 0 to 9). Let \(p\) be the proportion of all rolls that land on an even number.
Question 4a
Set up the hypotheses to test our claim.
Solution to Question 4a
\(H_0\):
\(H_a\):
Question 4b
Roll the die 20 times, and record how many times it lands on an even number (0, 2, 4, 6, or 8). If you do not have a ten-sided die, use the code cell below to simulate rolling a fair, ten-sided die \(n=20\) times.
Solution to Question 4b
# run code cell if you do not have a ten-sided die
sample(0:9, 20, replace = TRUE)
Question 4c
Calculate the p-value of your sample.
Solution to Question 4c
# code cell to help with calculations
Question 4d
What (if anything) can you conclude about the hypothesis at 10% significance level?
Solution to Question 4d
The Significance Level Revisited
The significance level of a hypothesis test is the largest value of \(\mathbf{\alpha}\) we find acceptable for the probability for a type I error.
Question 5

A company claims that only 3% of people who use their facial lotion develop an allergic reaction (a rash). You are suspicious of their claim based on hearing some of your friends had an allergic reaction, and you believe it is more than 3%. You pick a random sample of 50 people and have them try the lotion. If more than 3 out of the 50 people develop the rash, you will blow up social media with posts about the dishonesty of the company’s claim.
Question 5a
Set up hypotheses for this test.
Solution to Question 5a
\(H_0\):
\(H_a\):
Question 5b
Explain what type I and type II errors are in this case. Make sure you explain in the context of this example.
Solution to Question 5b
Question 5c
What is the probability of making a type I error?
Solution to Question 5c
# code cell to help with calculations
Question 5d
If you were to perform the hypothesis test at a 5% significance level, and you observe \(X=4\), what would be the result of the test?
Solution to Question 5d
Question 5e
For what values of \(X\) would you reject \(H_0\) at a 5% significance level?
Solution to Question 5e
Rejection Regions
When performing a hypothesis test at a significance level of \(\alpha\), the rejection or critical region, denoted \(\mathcal{R}\), is the set of all values of the test statistic for which we reject \(H_0\). The endpoint(s) of the region are called critical values.
Question 6
In Question 4 we tested whether or not a ten-sided die is fair by rolling it 20 times and counting the number of rolls that land on an even number. If \(p\) is the proportion of all rolls that land on an even number, then we have
\[H_0: p = 0.5 \qquad \mbox{vs.} \qquad H_a: p \ne 0.5.\]
Question 6a
If you found only \(X=7\) rolls landed on an even number, what is the p-value?
Solution to Question 6a
# code cell to help with calculations
Question 6b
Find the critical values and rejection region if we use a significance level of 10%.
Solution to Question 6b
# code cell to help with calculations
The Power of a Test
Question 7
Suppose you are interested in the lengths of a certain species of snake in an ecosystem. Assume the lengths (in cm.) are normally distributed with unknown mean \(\mu\), but the standard deviation of the population is known to be \(\sigma = 4\) cm. It has been claimed that the mean length of this species is 25 cm. You believe the actual mean length is greater than 25 cm. You collect a random sample of 30 snakes. You will test using a significance level of \(\alpha = 0.05\).
Question 7a
Set up hypotheses for the test.
Solution to Question 7a
\(H_0\):
\(H_a\):
Question 7b
Find the critical value, and give the rejection region.
Solution to Question 7b
# code cell to help with calculations
Question 7c
If in fact \(\mu = 27\) cm, what is the probability of making a type II error?
Solution to Question 7c
# code cell to help with calculations
Question 7d
What is the probability of correctly rejecting \(H_0\) when \(H_a\) is true?
Solution to Question 7d
Definition of the Power of a Test
The power of a test is the probability of correctly rejecting \(H_0\).
\[{\color{dodgerblue}{\mbox{power} = P(\mbox{Reject } H_0 \ | \ H_a \mbox{ is true}) = 1 - {\color{tomato}{\beta}}}},\]
where \(\beta\) denotes the probability of a type II error.
Additional Practice
Question 8
Let \(X_1\), \(X_2\), \(\ldots\) , \(X_{12}\) be a random variable from a Bernoulli distribution with unknown probability \(p\). We test
\[H_0: p=0.3 \qquad \mbox{versus} \qquad H_a: p < 0.3.\]
We will reject the null if the number of success \(Y= X_1 + X_2 + \ldots + X_{12} \leq 1\).
Question 8a
Find the probability of a type I error.
Solution to Question 8a
# code cell to help with calculations
Question 8b
If the alternative hypothesis is true, find an expression for the power, \(1-\beta\), as a function of \(p\).
Solution to Question 8b
# code cell to help with calculations
Question 9
You draw a random sample \(X_1, X_2, \ldots , X_{10}\) from an exponential distribution \(f(x; \lambda) = \lambda e^{-\lambda x}\) (recall \(\mu = 1/\lambda\)). You will test
\[H_0: \lambda = 0.25 \qquad \mbox{versus} \qquad H_a: \lambda < 0.25.\]
You decide you will reject the null hypothesis if at least 3 of the values of \(X_i\) are greater than 9.
Question 9a
Compute the probability of a type I error.
Solution to Question 9a
# code cell to help with calculations
Question 9b
If actually \(\lambda = 0.15\), what is the power of this test?
Solution to Question 9b
# code cell to help with calculations
Appendix: Summary of Hypothesis Testing
State the hypotheses and identify (from the alternative claim in \(H_a\)) if it is a one or two-tailed test.
- \(H_0\) is the “boring” claim. Express using an equal sign \(=\).
- \(H_a\) is the claim we want to show is likely true. Use inequality sign (\(>\), \(<\), or \(\ne\)).
- State both \(H_0\) and \(H_a\) in terms of population parameters such as \(\mu_1-\mu_2\) and \(p_1-p_2\).
Compute the test statistic.
- If the observed sample contradicts the null claim, the result is significant.
- A standardized test statistic measures how many SE’s the observed stat is from the null claim.
- A standardized test statistic with a large absolute value is supporting evidence to reject \(H_0\).
Using the null distribution, compute the p-value. The p-value is the probability of getting a sample with a test statistic as or more extreme than the observed sample assuming \(H_0\) is true.
- The p-value is the area in one or both tails beyond the test statistic.
- The p-value is a probability, so we have \(0 < \mbox{p-value} < 1\).
- The smaller the p-value, the stronger the evidence to reject \(H_0\).
Based on the significance level, \(\alpha\), make a decision to reject or not reject the null hypothesis
- If p-value \(\leq \alpha\), we reject \(H_0\).
- If p-value \(> \alpha\), we do not reject \(H_0\).
Summarize the results in practical terms, in the context of the example.
- If we reject \(H_0\), this means there is enough evidence to support the claim in \(H_a\).
- If we do not reject \(H_0\), this means there is not evidence to reject \(H_0\) nor support \(H_a\). The test is inconclusive.

Statistical Methods: Exploring the Uncertain by Adam Spiegler is licensed under a Creative Commons Attribution-NonCommercial-ShareAlike 4.0 International License.